Analytics
What You Will Find on the Page
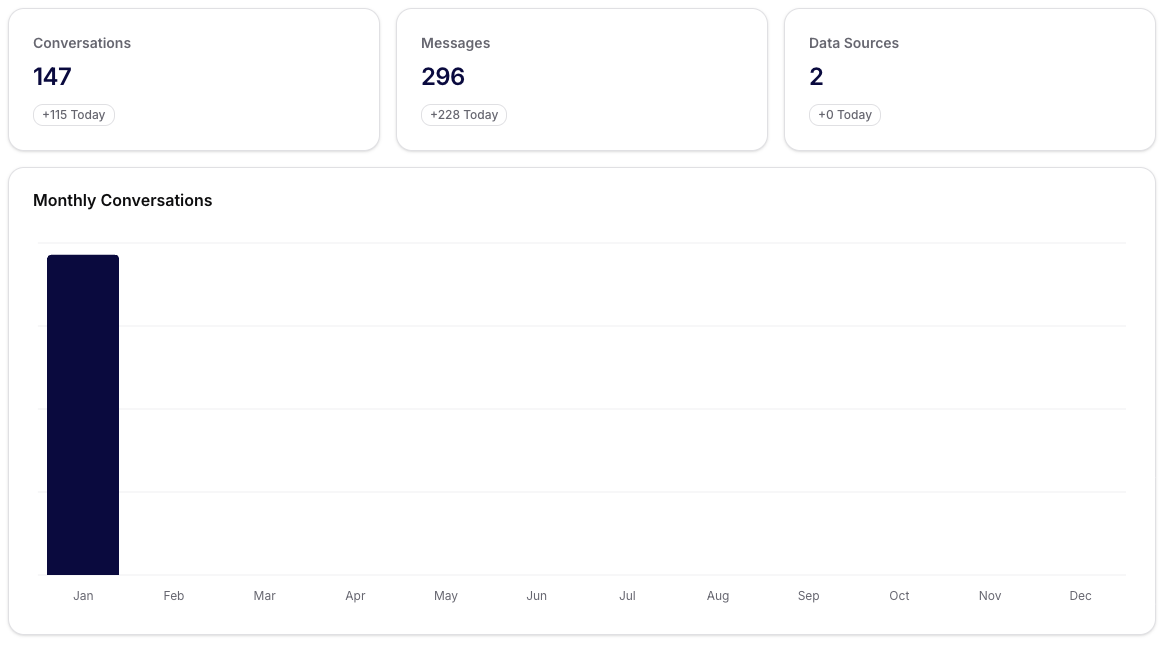
Analytics provides a quick overview of what is happening in the assistants. At the top, you will see the basic KPIs:
- Conversations: the number of completed conversations and daily change.
- Messages: the total number of messages from the last few days.
- Data Sources: how many sources you have connected (e.g., files, databases, APIs).
- Assistants: the number of active assistants.
Take these numbers as a “health check” – if any indicator unexpectedly drops, it is a signal to verify the configuration or content.
Monthly Overview of Conversations
Below the KPIs is a bar chart with a monthly summary of conversations. The X-axis displays the months, and the height of the bars indicates the volume of conversations. For quick diagnostics:
- Sharp drop = check the availability of assistants, connected channels, or recent changes in propositions.
- Growth = verify whether capacity (rate limits, resources) is keeping up.
Recent Negative Feedback
On the right, there is a box with the five most recent negative ratings of messages. Use it for quick iterations:
- Open the specific conversation.
- Find the message that the user rated negatively.
- By adjusting the prompt or source data, you can reduce similar complaints in the future.
Dashboard Example

Tips for Working with Data
- Monitor daily changes in KPIs to quickly identify fluctuations.
- If the number of messages is increasing without a rise in conversations, check the quality of responses (feedback) and possibly adjust the instructions.
- With zero data sources, verify that assistants have the correct datasets and access assigned.